(2)")
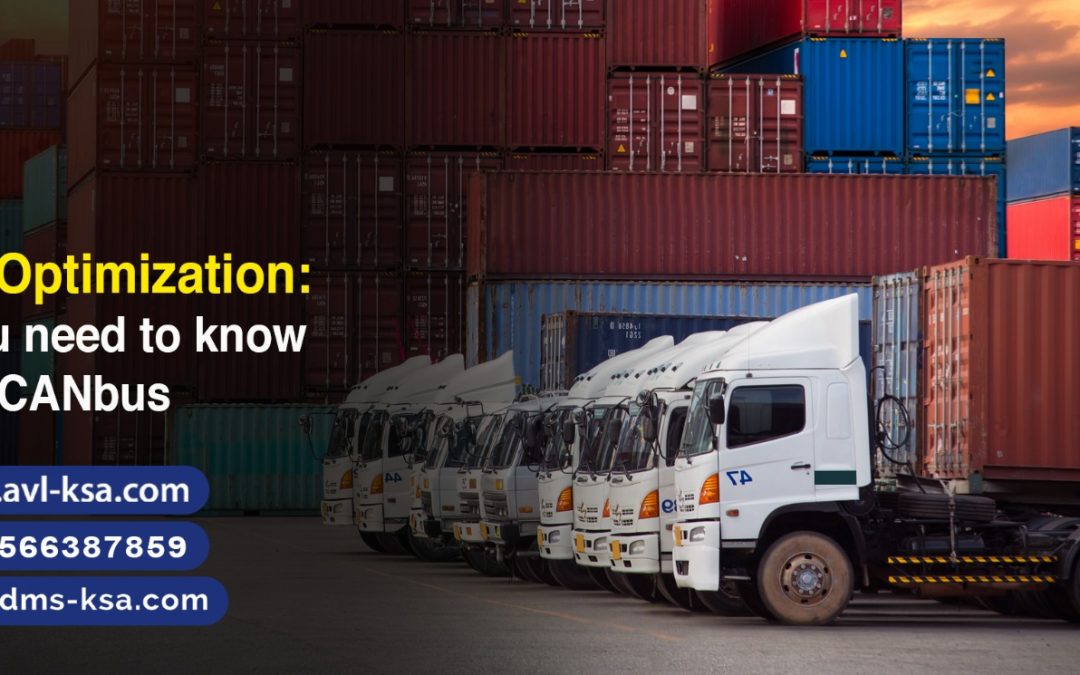
Fleet Optimization: All you need to know about CANbus
Fleet Optimization: All you need to know about CANbus
Telematics is a rapidly evolving technology that has transformed the automotive business. It has integrated several technologies, including CANbus data, GPS, cellular communication and sensors, to leverage data and allow remote data transfer seamlessly from vehicles to a central location.
The integration of CANbus data into fleet telematics has contributed greatly to the transformation of the automotive industry. The Controller Area Network (CAN) bus data is message-based protocol and is considered as a modern vehicle’s central nervous system that allows the vehicle’s Electronic Control Units (ECUs) and other devices, to interact with one another in a priority-driven manner. Every component in a vehicle can link to a single network bus, eliminating the need for numerous point-to-point cabling hops.


With the incorporation of CANbus, fleet managers can now optimize their fleet operations based on the data collected; allowing the better resource allocation. Since the invention of CANBus (in the 1980s), it has gone far beyond its originally intended scope and has made significant advancements. Currently CANbus data has two widely used versions. Standard CAN version uses an 11-bit message ID while Extended CAN version uses the extended 29-bit message ID.
Eagle-IoT® provides a full spectrum approach to fleet management with CAN protocol. The integration of CANbus allows the fleet managers to access the following information on Eagle-IoT® platform
· Diagnostic Trouble Code
· Total Engine Cold Running Time
· Engine (all starts count, cold starts count, starts by ignition count)
· Handbrake applies on the ride
· Coolant temperature
· Oil temperature
· Doors status
· Windows status
· Seatbelt status
· Lights Status
· Vehicle identification number (VIN)
Diagnostic Trouble Code (DTC) are generated to notify about vehicle engine’s issues. Each system within your vehicle has threshold limits. When the vehicle detects that the issue exceeds the threshold value, it sends out a trouble code. OBD data obtained from sensors embedded in your fleet can later be analysed to decide which components should be changed before they break down or cause an accident. Moreover, root cause of most issues can also be diagnosed remotely.
Eagle-IoT® also provides preventative maintenance strategy based on CAN protocol by integrating the following data with it’s fleet management software.
· Fuel Consumption
· Fuel Level
· Fuel Range
· Accelerator Pedal Pressure
· Service distance
· Pedal Braking Factor
· Total Accelerator kick down/time
Besides this, fleet managers can also access the information about
· Ignition Key
· Total Distance
· Total Fuel Used
· Total Engine Idle Time
· Total Idle Fuel Used
· Total Engine Hours
· Total Driving Time
· Ad-Blue Level
· Ambient Temperature
· Battery Charge Level
· Battery Voltage
· Tachograph information
· Vehicle Speed
· Axles Weight
· Engine RPM
· Engine Coolant Temperature
The CANbus data facilitates real-time monitoring of vehicle performance. With the integration of CANbus data in telematics technology, the industry has witnessed significant improvements in fleet management, insurance, autonomous vehicles, and the development of new services and business models. While there are challenges associated with the technology, such as the risk of cyber-attacks, it is clear that the integration of CANbus data into telematics technology is here to stay
It is crucial to pick the right solution that not only offers built-in reporting but also automates workflow with instant reminders along with analytics and insights on the issues. Eagle-I offers all that your business needs.
To know more about us


")
")
")
")
")