Why Choose Eagle-IoT as Your Preventive Maintenance Management Software?

Why Choose Eagle-IoT as Your Preventive Maintenance Management Software?

Why do you need Eagle-I as your preventive maintenance management software?

Fleet is the cornerstone of any business, if you’re not on top of fleet maintenance management, despite the numerous investments your business makes, none can be as significant as the one you are making in your fleet. Well-maintained fleets can not only save your drivers stranded in harsh weather conditions but it can also enhance the productivity of your fleet. An upkeep fleet requires a solid, long-term preventative maintenance strategy that not only maximizes fleet uptime but also extends vehicle lifespan, keeping your fleet well-maintained to assure the safety of your assets while they are in motion.

Without telematics, preventative maintenance can be complicated. Eagle-I provides a full spectrum approach to the maintenance of fleets. With the integration of OBD-II, a DTC or a Diagnostic Trouble Code, is generated to notify about vehicle engine’s issues. There are typically limits for each system within your vehicle. When the vehicle detects that the issue exceeds these limits, it sends out a trouble code. OBD data obtained from IoT sensors embedded in your fleet can later be analysed to decide which components should be changed before they break down or cause an accident. Besides this, root cause of most issues can also be diagnosed remotely.

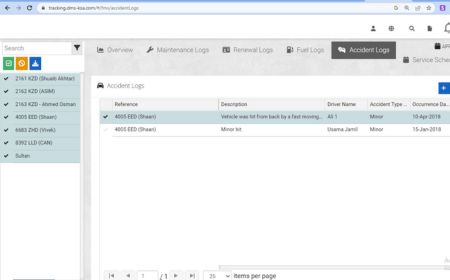
    A preventative maintenance strategy is developed by integrating engine data, fuel consumption, tyre management, and odometer readings with fleet management software. Eagle-I also offers scheduled periodic maintenance for your fleet. The scheduled maintenance is a calendar-based maintenance that occurs at repeating intervals or in response to a work request. It can include things on the “daily” or “weekly” basis. To ensure streamline operation, Eagle-i, Service and Renewal module can be used to schedule your maintenance work without disrupting your daily operations. Scheduled maintenance can be based on date or distance. Eagle-i has capability to send email notifications to authorized personnel when an asset’s periodic maintenance gets due.

      Using Eagle-I preventive maintenance solution can help automate processes and keep reports and historical data intact. Besides this preventive maintenance can prolong life expectancy of assets, reduced unplanned downtime, fewer breakdowns of fleet, improved reliability of mission-critical assets. It is crucial to pick the right solution that not only offers built-in reporting but also automates maintenance workflows with instant maintenance reminders along with analytics and insights on maintenance-related issues. Eagle-I offers all that your business needs.

      To know more about us

      ..
      A guide to plan a successful thermal mapping study

      A guide to plan a successful thermal mapping study

      A guide to plan a successful thermal mapping study

      As per the new guideline issued by Saudi Food and Drug Authority (SFDA), it is mandatory for temperature-controlled facility to have Data-Driven Thermal Analysis to meet the new requirement of Storage Regulatory. In a controlled temperature environment (CTE), temperature fluctuation is far from straightforward. With the implementation of thermal mapping technique, we can stabilize the temperature and humidity in a controlled environment (such as a warehouse, refrigerator, or vehicle). It ensures that your products are kept within the certain temperature range, minimizing the chances of spoilage or damage. Besides this, the study allows to identify any potential hot or cold locations which could possibly jeopardize the temperature-sensitive items.  

      _thermal mapping

       Here is Eagle-IoT guide to carry out successful thermal mapping study in cold chain facility with the most accurate data possible

      Data Logger selection for thermal validation

      In the past few years, technology in dataloggers has come a long way. Enhanced accuracy, improved response time, increased battery life, flexibility and software have played their part within the industry. Selection of data logger is crucial depending on the type of facility and operation. Wireless data sensors are now available with an accuracy of ±0.05°C along with interchangeable sensors for measuring humidity, pressure, conductivity and CO2 depending on client requirement.

      Quantity of Data Loggers

      The quantity of data loggers depends on the measurement of the area to be monitored. The area under monitoring is defined as all quadrants and possible spot location areas in which the product can be exposed. Besides this, number of data loggers also depends on the number of measurement points inside the area of monitoring in a particular equipment chamber, cleanroom, or product pallet. 

      */Typically, before the start, thermal mapping monitoring is important to prepare a specific as-built drawing representing the dimensions of the area to be measured with space to add the location number of each data logger in a particular quadrant equidistant to each other to cover the entire area./*

      Digitize your Waste Management infrastructure
      Digitize your Waste Management infrastructure

      External influence consideration

      Another important factor that needs to be considered during a thermal mapping study is the effect of external influences. Seasonal temperature variations play a crucial part in this study. Therefore, it is recommended by Eagle-IoT experts to carry out this study at the coldest and hottest time of the year to ensure the accuracy of the data.

      Identify critical mapping points

      Thermal mapping study will help you to identify the crucial data sensor placement for the storage envelop. Storage envelop is a term used to refer the designated area for storing the products in a warehouse. Factors needs to be considered for storage envelope include storage rack numbers, storage rack dimensions, storage rack and product spacing, and thermal mass distribution. This study also indicates the hottest, coldest and average temperature locations for continuous monitoring system.

      Digitize your Waste Management infrastructure
      Digitize your Waste Management infrastructure

      Data analysis 

      Equipped with years of industry-leading experience there’s no task too big or too small for our dedicated teams. Eagle-IoT data logger specialist can configure data sensors for you, and can install ready-to-use data loggers in your facility for collecting data from your thermal mapping study. Besides this, at the end of thermal mapping study, Eagle-IoT offers data extraction, evaluation and detailed statistical analysis with graphical representation of average, maximum, and minimum points.

      To ensure the mapping study benefitting, it is essential to consider all the critical points deemed important by the end user. Depending on the scope of the project, factors such as study length, the temperature range acceptable for operation, the quantity of sensors, sensor locations, and storage envelope parameters, affecting the study will be different   

      Discover the performance of your facility and get it assessed by our experts today 

      Post Views

      Driver scorecard-First step to the safety of your fleet

      Driver scorecard-First step to the safety of your fleet

      Driver scorecard-First step to the safety of your fleet

      No matter what the size of fleet is, safety of the asset and driver is always of the utmost importance for any fleet manager. To address the safety concerns of asset and to monitor the driver’s performance, driver scorecard was designed.

      Driver scorecard initially emerged as an important metrics in the start of 2000 as a mean of measuring fuel economy and safety. It is a common saying you cannot manage what you cannot measure. However, with the evolvement of telematics it was developed as a tool for measuring the performance of drivers. The primarily focus of driver scorecard is to measure the aggressive driving, seat belt usage, and speeding that depicts the behavior of driving.

      waste management truck

      The most distinctive characteristic of driver scorecard is the properly managed statistical data presented in interactive charts and images that helps in understanding the performance of driver without having any prior knowledge.

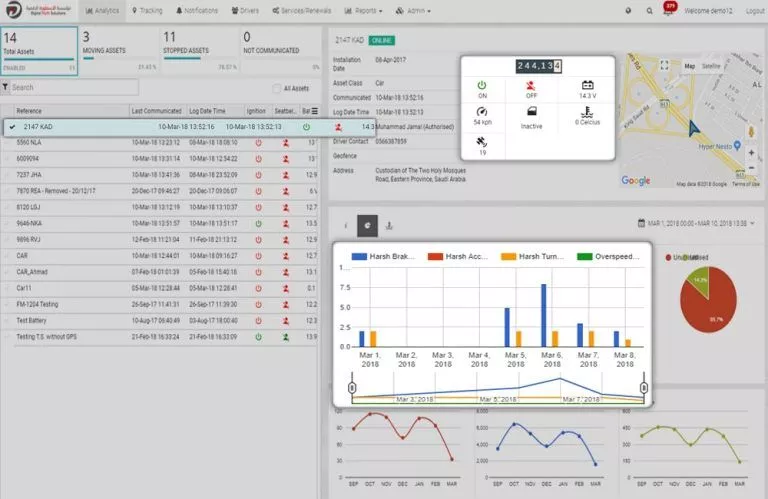
      Eagle-I driver’s scorecard enables you to monitor the performance of your driver based on speeding, harsh braking, harsh acceleration, and idling. This report can be utilized to modify the driver behavior depending upon his practices. Moreover, it can also be customized according to individual preferences. Eagle-I dashboard gives you the power to review the performance of individual driver based on this six monthly history with interactive images and charts.

      Operating the fleet in a same manner will eventually help an organization in improving the fuel economy along with the less wear and tear of vehicle. Not only this, safe driving behavior may earn you discounted insurance premium as many automobile insurers are integrating telematics based information in their policy.

      Digitize your Waste Management infrastructure

      Post Views

      Make Your Waste Management Smart with IoT-enabled Smart Sensors

      Make Your Waste Management Smart with IoT-enabled Smart Sensors

       Make Your Waste Management Smart with IoT-enabled Smart Sensors

      The amount of trash generated varies greatly throughout urban locations, trash cans in a different place on the same street doesn’t even fill up at the same rate. Nonetheless, municipality allocate a significant number of resources to visit all of the trash cans and waste bins at the same frequency, at the same time. Handling a large number of garbage trucks throughout the city and planning their routes to pick up every dumpster is neither cost-effective nor time- or resource-efficient. The issue is not just restricted to monitory terms; it also pertains to service quality.

      waste management truck

      However, with smart waste management, the collection of waste can be revolutionized. It can optimize waste collection while offering increased visibility for all key stakeholders with a network of sensors

      Smart sensors detect bin fill levels and keep an eye on diverse range of waste (mixed waste, paper, plastic, glass, textiles, bio-waste, liquids, electronics, metal, etc.) in bins and containers. The sensors are strong, shock- and water-resistant, completely operational across a broad temperature range, and programmed to measure from 3 cm to 12 m.

      eagle-I fuel level monitoring and Eagle-I carbon emission module.

      When it comes to the collection and disposal of trash, smart waste management offers a lot of perks. The routes are optimized to assure the pick-up of the full bins and leave the empty ones. Besides the collection route to be tailored,  also makes certain to have better fuel economy and less CO2 emissions which can also be monitored with Eagle-IoT fuel level monitoring and Eagle-IoT carbon emission module. 

      Digitize your Waste Management infrastructure

      Eagle-I smart waste management solution also allows you to measure water level in a manhole with fully adjustable water level indicators (tentacles) for different depths. Sensors can detect up to 3 different thresholds up to 25 meters. With the rising water level, the tentacles recognize when they start floating and send event-driven notifications via GPRS or GSM network as an early overflow warning. Customized notifications can also be sent via SMS or email.

      Gain full control over the bins and manhole to stay update with any arising critical condition.

      Contact us today to know more about dynamic waste collection. 

      Digitize your Waste Management infrastructure
      Fleet Intelligence Just Got Better!

      Fleet Intelligence Just Got Better!

      Fleet Intelligence Just Got Better!

      Having the ability to monitor and analyze data is very important when it comes to keep track of your fleet vehicles. For an organization to have an edge in the competitive market one need to have an insight of operational activities in your fleet. This insight can be achieved by making a connection between your asset and integrating telematics with your business systems. Eagle-I has integrated power BI to provide the insight of what’s happened in the past and what’s happening in the present, and what might happen in the future. The integration of Power BI has enhanced the machine learning capabilities of Eagle-I to spot patterns in data and use those patterns to make informed predictions allowing fleet managers to generate forecasts and prepare themselves to meet future demand and other key metrics of running smooth fleet operations.

      With the adoption of data-driven decision-making strategy in an organization significant improvement can be experienced. The fleet management systems consist of the data from the utilization of assets to their maintenance, compliance, accidents, and disposal. The integration allows the data from different operating systems to be gathered at a single platform which can be later used for analysis. This not only simplifies the cascade of data for analysis but also improves efficiency and saves the time of an organization by having all the relevant information in one place for decision-making.

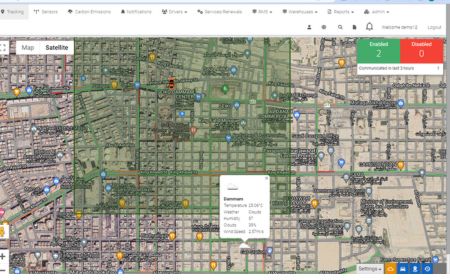
      The dashboard of customized telematics platform looks a like the front page of newspaper broadcasting exclusive dashboard reports with critical values while cutting down visual clutter to ensure fleet managers can analyze fleet activities rapidly while reducing navigation time. An effective vehicle tracking and fleet management system such as Eagle-I offers easy to use interface to provide custom access to fuel tracking, OBD data to determine engine fault codes. Eagle-I driver scorecard features over-speeding violations, harsh braking, harsh acceleration, harsh cornering, hours of service, idling, seatbelt violation. Eagle-I Driver Reports are designed to provide detailed information about driver behavior, their performance, miles traveled and violations.

      The detailed analytics of driver performance can be used to customize the safety thresholds for your fleet. Eagle-I driver scorecard equips you with driver rating based on their driver behaviour for the past few weeks, months, or quarters. This will help the fleet managers to see the trends in driver behavior and how they are impacting the business. Moreover, CO2 emissions, fleet budgeting or cost-saving analyses across numerous vehicles can also be integrated into your custom solution.

      Eagle-I offers advanced reporting which delivers the customized information you want, the way you want it, when you want it. Eagle-I reports comprises of


      • Asset based data
      • Driver based data
      • Location based data
      • FMS / Admin Reports

      Eagle-I Care division can also send specific reports to the clients on daily or weekly bases. 

      To ensure the complete utilization of the fleet software, a well-trained staff capable of handling the software is also of significant importance. The data collected, stored, and analyzed by the system can only make sense if it is

      clearly understood by the operators. This information loses value if proper actions are not taken to solve the problems that have been detected without delay.

      To learn more about Eagle-I fleet management and vehicle tracking system visit our website or contact us at info@dms-ksa.com today. Our experts would be happy to customize the best vehicle tracking features for your needs.


      ×