(2)")
Fleet Analytics
Eagle-I Fleet Management System is an extremely powerful tool when it comes to fleet analytics.
Fleet overall performance can only be analyzed with the correct set of data and relevant performance metrics. Eagle-I not only ingest and plot data, the analytics engine under the hood provide insights and KPIs in such way that makes it a best investment for your fleet.
Analysis Pillars

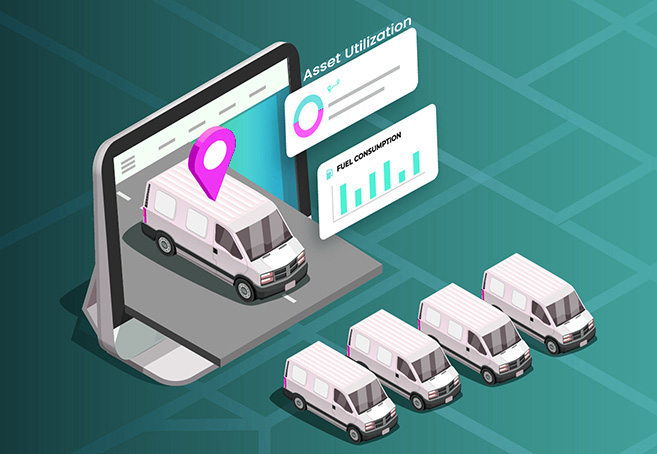
Asset Utiliztion
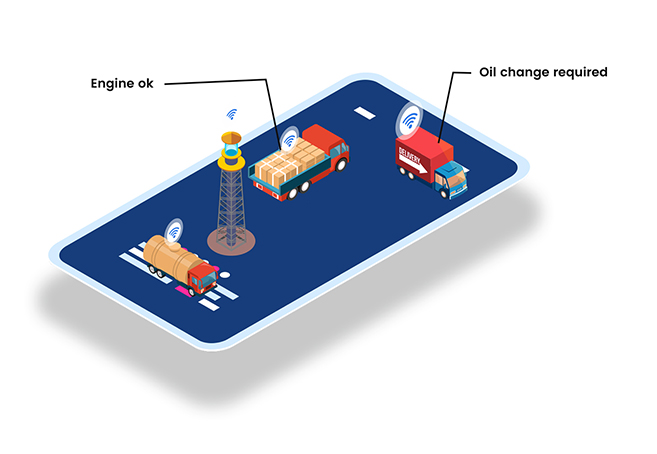
Maintenance Cost

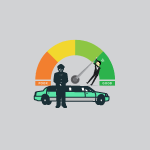
Driver Behavior
Benefits of Relational Analysis

Prevent Over utilization And Which Increases Unnecessary Maintenance Costs

Identify The Underutilized Assets And Distribute The Workload Uniformly

Normalize The Maintenance Costs With Proper Scheduling
Reach Out To Drivers Having Low Performance And Directly Effecting The Operations And Fleet Health