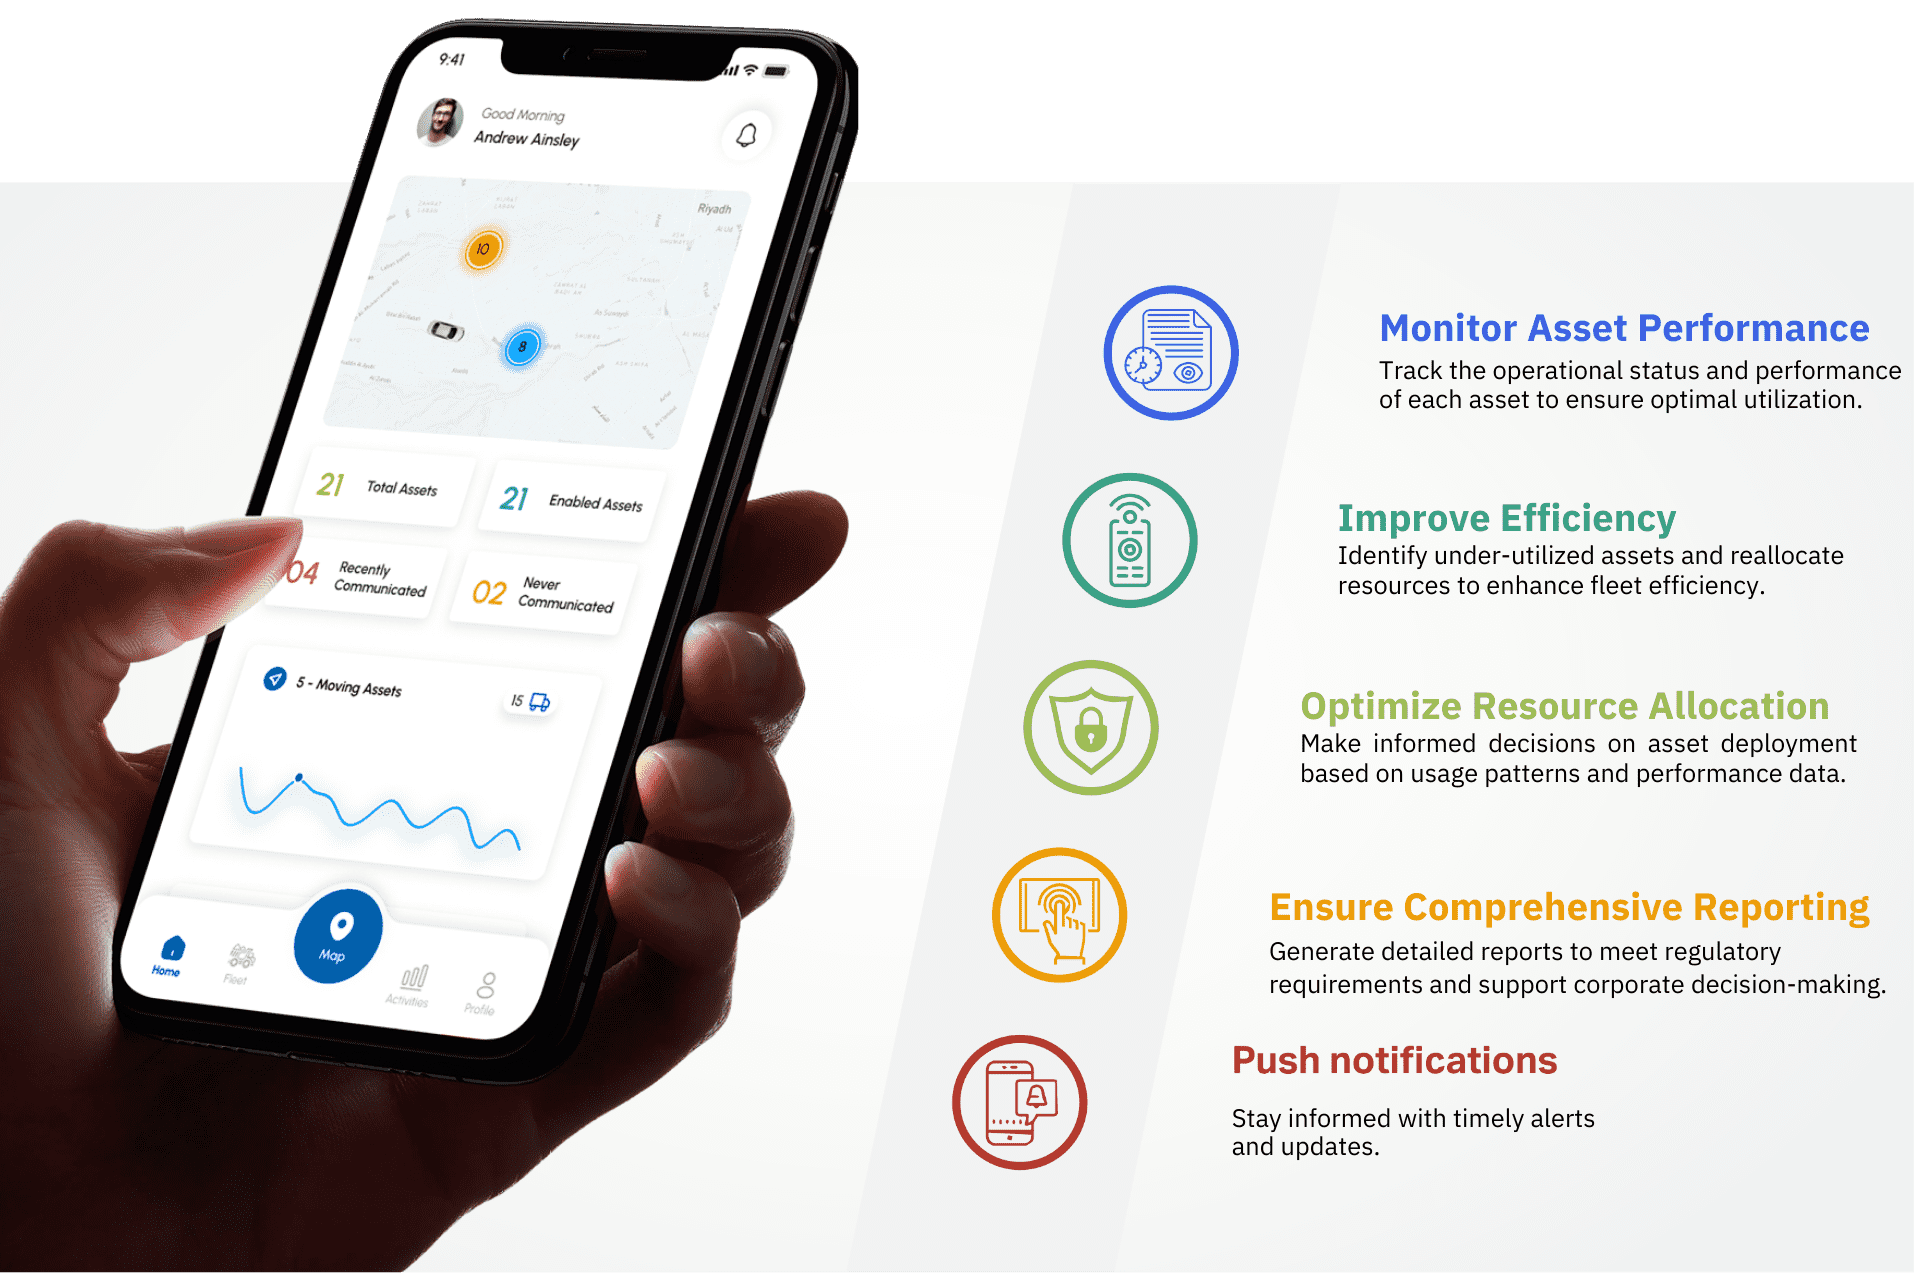
Fleet Utilization
Maximize Fleet Efficiency with Advanced Fleet Utilization Insights
Monitor, Analyze, and Optimize Your Fleet’s Performance in Real-Time

What is Fleet Utilization?
Eagle-IoT Fleet Utilization provides fleet managers with detailed insights into the operational status and performance of their assets. By leveraging real-time data and advanced analytics, our Fleet Utilization features help you ensure optimal usage, improve efficiency, and make informed decisions for better resource allocation
Unified Asset Details
Eagle-IoT offers a comprehensive fleet management system with a centralized dashboard for real-time visibility into all your assets. This powerful tool allows you to effortlessly identify assets through unique identifiers, track their precise deployment location, and categorize them for efficient management. Manage assigned drivers (if applicable) and understand the specific type of each asset for optimal resource allocation. Get real-time status updates on each asset, including it’s operational state and engine status.

Maximize Fleet Efficiency with Advanced Fleet Utilization Insights
Granular Utilization Data for Smarter Fleet Management
Gain a comprehensive understanding of your fleet’s activity patterns over the past month with a visual representation of average and peak utilization percentages. This data helps you identify periods of high and low demand, allowing for informed resource allocation. Detailed reports for the last 7 and 14 days provide a comprehensive view of recent activity. Key metrics like utilized hours, total trips, accumulated hours, distance traveled, and total assets tracked offer valuable insights for optimizing your fleet’s operations.
Utilized Hours
Total time assets have been in use.
Total Trips
Number of trips made by the fleet.
Distance Traveled
Total distance covered by the fleet
Total Assets Tracked
Comprehensive visibility into your entire fleet.


Real-Time Visibility into Asset Status
Comprehensive Overview
Gain an immediate understanding of your entire fleet’s activity with a clear visual representation of asset statuses, categorized as Working, Idling, Stopped, and Not Communicated
Actionable Insights
The utilization pie chart instantly highlights the percentage of over-utilized, fully utilized, and under-utilized assets, empowering data-driven deployment optimization.
Performance Monitoring
The performance pie chart readily identifies the performance level of your assets, categorized as Good, Fair, and Bad. This prioritizes maintenance and ensures optimal operational efficiency.


